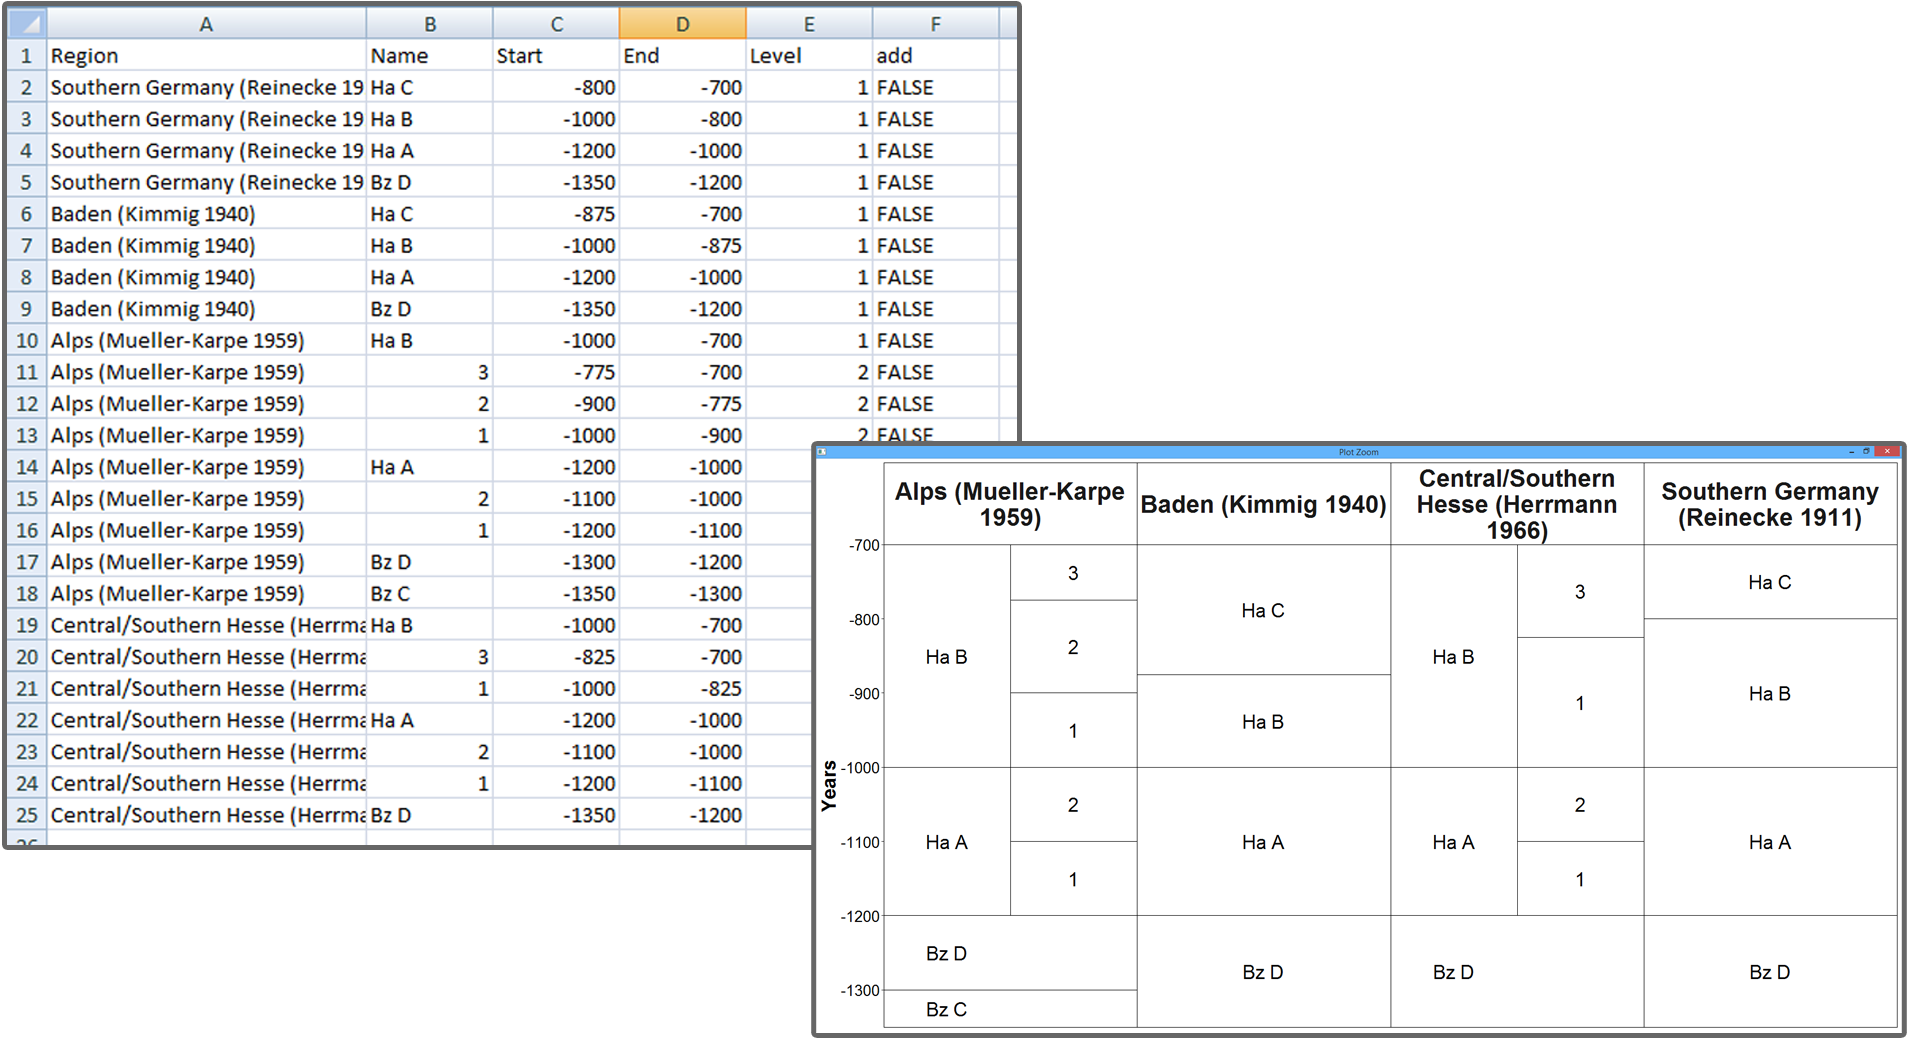
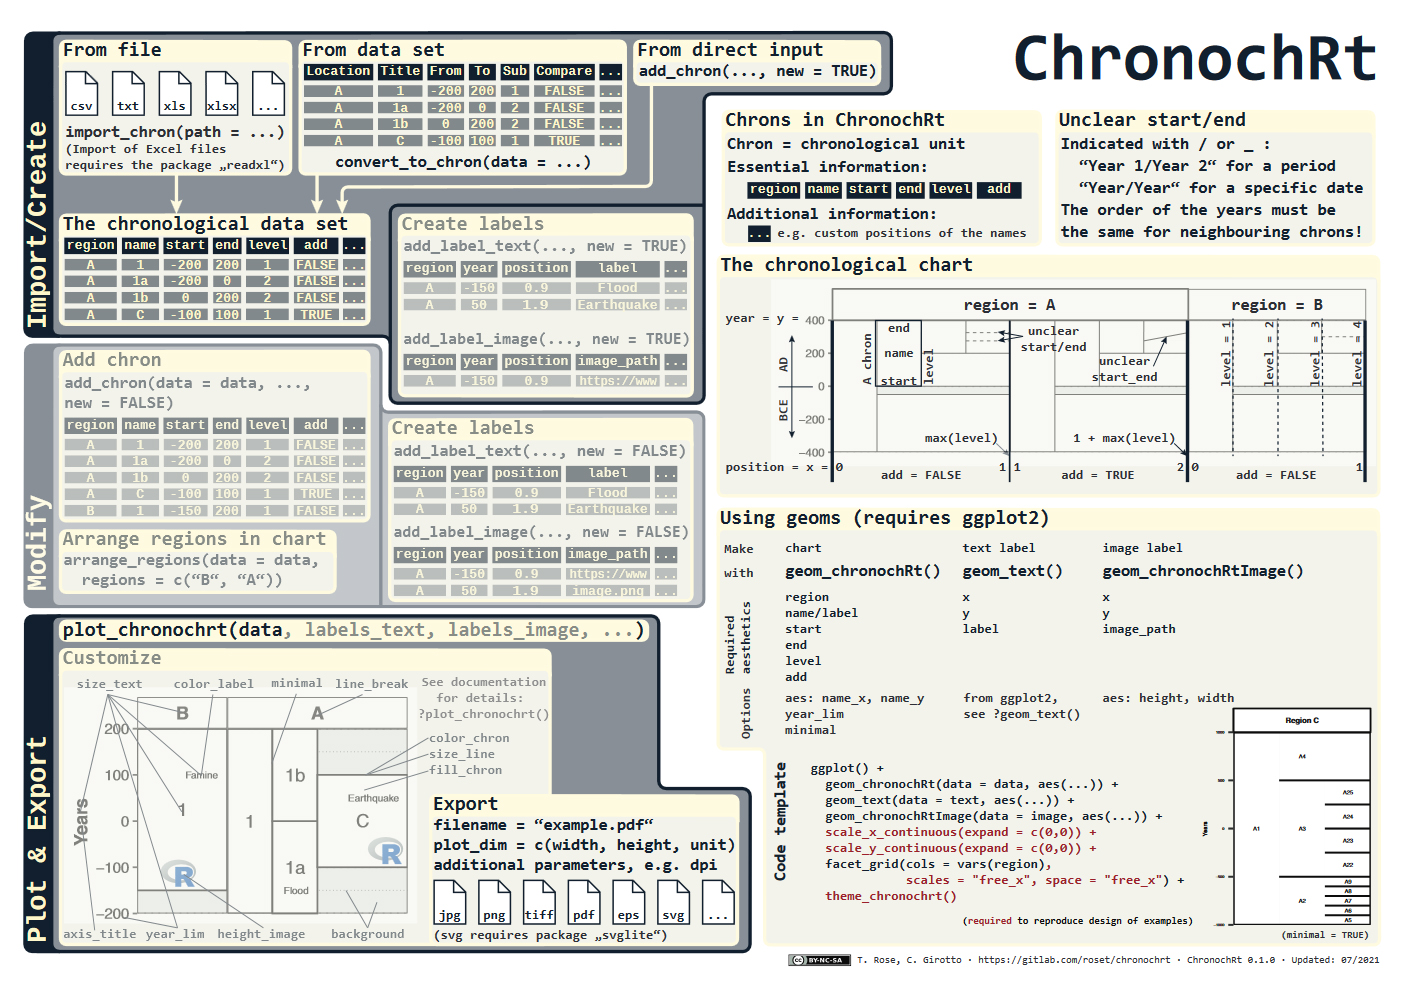
ChronochRt is an R package that aims to facilitate the design of archaeological chronological charts. Designing such charts often is very tedious and the layout of them takes much more time than the compilation of the data behind. Things often get even more complicated when an existing chart must be updated (e. g. because of refined dates).
Developed together with C. G. M. Girotto (LMU München), chronochRt extends the popular visualisation packge ggplot2 to provide an easy and replicable way of creating chronological charts directly from a dataset. The datase is designed in a way that each chronological unit is self-contained, making e. g. subsetting and filtering of the dataset easy. Only one command is needed to convert this dataset into a publication-quality chronological chart while offering the full flexibility of ggplot2-visualisation when it comes to further customisation. The package also includes a set of functions to facilitate its use for users new to R. Special efforts were made to provide telling error messages for easy trouble-shooting.
Learn more about the package on its Gitlab page or download it from CRAN and try it out!
Publications
- Rose T, Girotto C (2021) chronochrt: Creating Chronological Charts with R. R package version 0.1.0. https://CRAN.R-project.org/package=chronochrt
Presentations
- Rose T, Girotto CGM (2019) ChronochRt: Ein R-package zum automatisierten Erstellen von Chronologietabellen. 9. Workshop der AG CAA Deutschland, Wilhelmshaven.
- Rose T, Girotto CGM (2021) ChronochRt: Make chronological charts with R. CAA 2021, virtual.


